2021-03-16
Inside the Gas Analyser – the Interferometer
Several of OPSIS gas analyser types utilize the DOAS technology to establish the concentration of gases. To do so, we need access to absorption spectra in different wavelength regions. A fairly straight-forward way to record spectra is to use a spectrometer.
However, the spectrometer device is generally at its best in ultra-violet (UV) and visible wavelength regions. It can also be used in the infrared (IR) wavelength region, but it is difficult to get the spectral resolution required for detection of really low gas concentrations. Sometimes it is not needed and OPSIS then offers spectrometer-based analysers working in the IR region. In other cases that’s not enough. Luckily, there is a work-around – the interferometer.
Now, here is where it gets a bit tricky. It is fairly easy to understand what a “spectrum” is. We have all seen a rainbow, and that’s an example of a spectrum. Contemplating a spectrum in other than visible wavelengths or the "resolution" of a spectrum is also fairly straight-forward. It is all based on the perception of light as being electromagnetic waves, with different wavelengths for different colours in the spectrum.
Wavelength vs. Frequency
However, there are different ways to describe and measure light. One is to consider light as being particles, called photons. Another way is to stay with the wavelength-based description, but instead look at the “inverse of wavelengths”. It may sound strange, but we all know the approach from a different type of electromagnetic waves: radio signals. By example we often talk about the frequency (“f”) of radio stations tuned in on an FM radio, typically around 100 MHz. But we can just as well also speak of the wavelength (“L”) of the radio transmission. We can even see the wavelength on an old-school radio receiver: the antenna is often just below a metre long. It’s an antenna design called a “quarter-wave antenna”. The wavelength is therefore four times the length of the antenna, around 3 metres. Hence, the same radio transmission can be described either as “100 MHz” or as “3 m”. The link between f and L is the fixed speed of light (“c”, 300,000 km/s): f = c / L.
It works the same for electromagnetic waves in the optical region. What we describe as a wavelength in e.g. the IR region (often stated in micrometres) can just as well be describe as a frequency. It gives a very high frequency, in the terahertz (THz) range or above, but it is a frequency. However, to make the numbers easier to manage, there is a convention where the wavelength just is inverted without bothering about the speed of light. We get a “wavenumber” instead of a frequency. The unit is the “inverse of length”. In the IR region, it happens to be convenient to speak of inverse centimetres (cm-1).
The Interferometer
So, where does all this take us? Well, there happens to be a device that records the wavenumbers instead of the wavelength. It’s called an interferometer and looks as follows. It’s a little strange setup at first glance, but read on and “there shall be light”:

A Michelson interferometer.
Incoming light is sent through a semi-transparent mirror (a “beam splitter”) mounted at 45 degrees to the incoming light path. 50 % of the light is reflected, 50 % is transmitted through the mirror. Each of the two outgoing beams then hits a 100 % mirror, and the beams are returned in exactly the same direction as they came from. The beams therefore meet again at the beam splitter, where half of the light again is reflected and half is transmitted. We put a light sensor in the remaining direction going out from the beam splitter.
So what’s the point with all this? Actually none at all as long as the setup is static, but let’s move one of the 100 % mirrors slightly while we send in single-coloured (monochromatic) light, and watch what happens at the sensor:
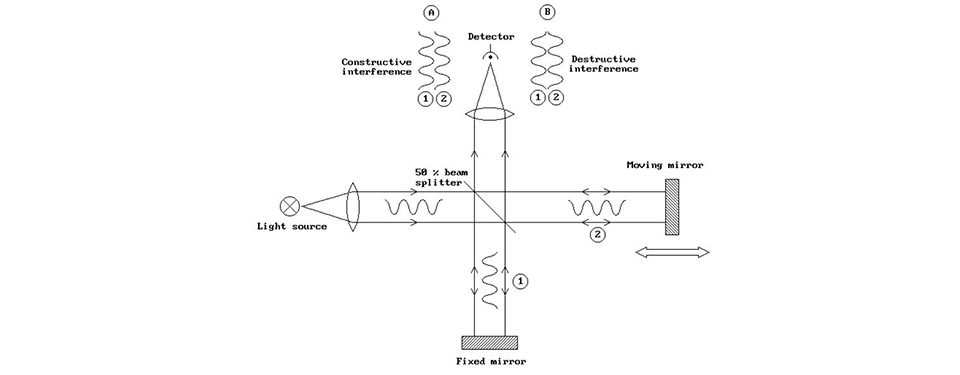
Constructive and destructive interferences.
Depending on mirror position, the two light beams (think of them as waves) going towards the sensor will in some cases cooperate and give a strong sensor signal. It’s called constructive interference. However, move the mirror just slightly (actually one quarter of the wavelength of the incoming light) and the two waves will instead cancel each other. It’s called destructive interference. If we now move the mirror at a fixed speed, we will get a sinus-shaped signal from the sensor. It illustrates the frequency, or if we so prefer the wavenumber of the light, and it's called the “interferogram”.

A monochromatic spectrum (left) and its interferogram (right) – never mind the axis units!
Interferograms
If we send in a slightly different colour (a different wavelength), we still get a sinus-shaped signal from the sensor, but with a slightly different period. It is still an interferogram, just for a different colour.
Now, let’s make it a bit more complicated and by example send in three different colours. The sensor will see the sum of three different sinus waves with slightly different periods. There is still constructive interference in some mirror positions and destructive in some others, but in a more complex pattern. Nevertheless, it is still the interferogram of the incoming three-colour spectrum.
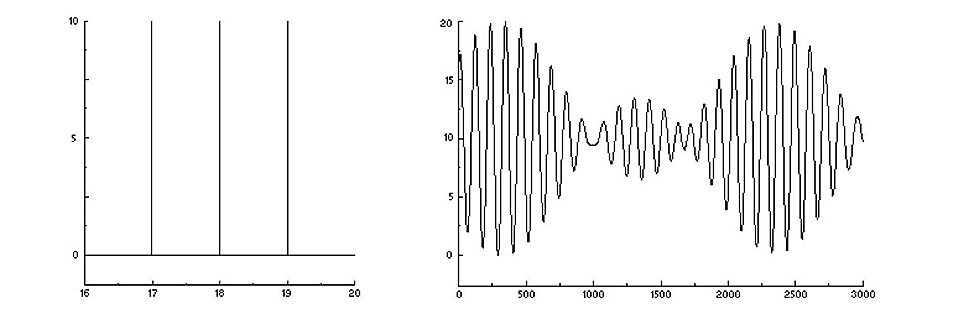
A three-colour spectrum (left) and its interferogram – three added sinus waves (right).
Sending monochromatic light or even three-colour light into an interferometer can explain how it works, but it is not very interesting from a spectroscopy point of view. To be useful, we have to send in light from a source with a continuous emissions spectrum, where all imaginable wavelengths (within practical limits) exist at the same time. What happens then?
The interferometer continues to work as before. It is just that an almost infinite number of wavelengths generate a sensor signal based on the sum of an almost infinite number of sinus waves. That signal can be very complex and might be hard to imagine, but it is still the interferogram of the incoming light. With a continuous spectrum (within a certain wavelength window), it can look like this:

A continuous spectrum (left) and its interferogram (right).
Spectra and Interferograms – two Sides of the Same Coin
So by scanning the interferometer, we can record the interferogram of the light, and it is expressed in units of wavenumbers. Compare this with using a spectrometer to record a spectrum, expressed in units of wavelengths. Actually, the interferogram and the spectrum of a specific light source carries the same information about the light. We can describe the frequency (wavenumber) of the light or we can describe the wavelength of the light, but it’s the same light we speak of.
So we’ve got the interferogram, but to apply the DOAS technique, we still need the spectrum. Looking at a "one-colour" interferogram we can calculate the wavelength by just inverting the wavenumber. But what to do with a full, complex wide-band interferogram? The answer is a mathematical procedure called a Fourier transform. It would go way too far to explain how this works, but just think of it as a “mathematical black box” (it’s just math in a computer, not a physical device) which is fed with the interferogram, and out comes the spectrum. It actually works the other way too, but that’s of lesser interest in this context. And now when the spectrum finally is established, it is brought to the DOAS algorithms and the sought-after concentrations of different molecules can be calculated.
The Detour – Why and When?
Right, but still, what’s the point with all this? Why not use a straight-forward spectrometer when the end product anyway is a spectrum? The answer lies in the resolution in the IR region. If we want low detection limits and high accuracy when measuring gas concentrations, we need absorption spectra with high spectral resolution. Now, we started this article by saying that the spectrometer works excellently in the UV region, but not so good in the IR region. In some cases when we want to measure absorption in the IR region, the spectrometer just isn’t good enough. Luckily, the interferometer is the complement to the spectrometer. It gives excellent spectral resolution in the IR region, which is just what we are looking for.
Unfortunately, the interferometer doesn’t work very well (in practice not at all) in the UV region, but there we have the spectrometer for recordings of high resolution UV spectra. In practical gas monitoring applications, it’s not unusual to have the need to detect some gases with their sought-after absorption lines in the UV region and some with their lines in the IR region. It’s therefore quite common to find OPSIS monitoring systems with two different instruments running in parallel, one based on a spectrometer (an AR500 or AR600) and another based on an interferometer (an AR550 or an AR650).
The gas analysers with interferometers inside (“FTIR-DOAS analysers”) are more complex than their spectrometer-based siblings (“UV-DOAS analysers”) but they are still family. The former takes a detour via an interferometer and the Fourier transform to establish the spectrum, but they share the fundamental measurement principle: using light absorption to establish the concentrations of pollutants.
