We all deal with averages every day without even thinking about it: has it been cold day, has it been windy? We intuitively form the overall perceived average temperature or wind speed to respond yes or no to those questions.
If needed, we can also calculate a more exact average: take notes on the temperature displayed on a thermometer let’s say every hour, add the values, and divide by the number of hours you managed to stay awake for notetaking. We all learn that in school, and we might even have learnt that it is called the “arithmetic average”.
Where it Might Go Wrong
So, what’s the issue when it comes to air quality and meteorology? Let’s look at the average of a wind direction, and let’s say we have noted it momentarily once every hour for the past 24 hours. What’s the daily average? If you don’t stop and think, you might just add the 24 directions and divide by 24. That might give the correct value, but it can also go very wrong.
Say that the wind was between north and north-east half of the day (0 to 45 degrees with respect to its origin) and between north and north-west the other half (315-360 degrees). The average direction is intuitively something close to the north, but if you just form the arithmetic average, you get something close to 180 degrees which suggests southerly winds.
Clearly, we cannot calculate an average wind direction as an arithmetic average, and the reason is that the direction reading 359.9 is seamlessly followed by 0.0. We need to rely on vectorised averaging instead.
Vectorized Averaging
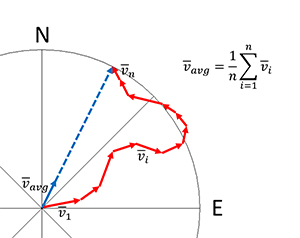
A vector is an arrow, to put it simple. It has a length and an orientation, and these two properties cannot be separated because then you lose parts of the information on the arrow. “Wind” is also a vector, with the length being the wind speed and the orientation being the wind direction. In fact, it’s a three-dimensional vector since there usually are both horizontal and vertical wind components, but let’s disregard that for now and just think of it in two dimensions, like on top of a map. The two numbers (speed and direction) must be kept together to give the full picture.
To calculate the average wind direction, you need to add the individual “wind arrows” and see where the resulting arrow points. Mathematically you do it by introducing a coordinate system where (for example) the x-axis is the east-west direction, and the y-axis is the south-north direction.
Now, calculate the arithmetic means of the projection of the individual wind arrows on the x axis and y axis, respectively. The average wind direction is then arcus tangent of the quotient of the resulting y-axis and x-axis components. You need to manage the case where the x-axis component approaches zero (flip the quotient) and attend to some angle offset and direction issues, but that’s simple adding and subtraction.
The Weighted Results
What we get with this vector-based calculation is the “wind-speed-weighted average wind direction”. While at it, Pythagoras theorem straightforwardly also gives us the “wind-direction-weighted average wind speed”. This is what you should look at if you want to see how the air volume has moved from start to finish of the averaging time, and that’s often what’s relevant for studying how air pollutants move from their sources.
Practical Use, Shortcuts
Software made for studies of time series of air quality data including wind data should have a setting to enable vectorised averaging for at least the wind direction (unit vector) and preferably for the pair of wind speed and wind direction (true vectorised averaging).
If we only have the original direction data without any speed data, we can still calculate a vector-averaged direction. It is done with a unit-length vector (length 1) meaning that we assume the wind speed stays the same during the averaging time. It doesn’t give exactly the same direction average as the windspeed-weighted average, but it can be good enough, at least for shorter averaging periods. However, an arithmetic average of wind direction data is just bad data management.
How to Spot Incorrect Averaging
Incorrect direction averaging can sometimes be revealed by looking at the frequency distribution of reported average wind directions over a longer time. If there are oddly few observations in a narrow-enough northerly segment compared to neighbouring segments while close-to-south directions seem overrepresented, then you should take a closer look at the math. There can of course be natural explanations, but it doesn’t hurt to double-check if the “vector flag” really was set when forming the averages.
Wind speed data can also be averaged on its own, as a regular arithmetic average. This gives the perceived wind speed, ignoring any changes in wind direction. The difference compared to the vector-averaged speed can be apparent. In an extreme (although unrealistic) case with eastbound storm half of the averaging time and westbound storm the other half, the vector-averaged speed is zero, but you will have noticed the arithmetic average – it’s been windy!
About the Author
Bengt Löfstedt
Operative Support, OPSIS AB